Here's some of my favorite projects.
Some of the technologies I used for my projects are: Python, Pandas, Jupyter Notebook, Matplotlib, Restful APIs, SQL, PostgreSQL, MongoDB, HTML, CSS, Javascript, D3, Plotly, Chart.js, Leaflet, and Machine Learning library Scikit-Learn.
Renewable Predictions
Using historical data available between the years 1970-2017 for renewable energy production and total energy consumption values, make predictions for the next 10 years. Using Pyhton Machine Learning library Scikit-Learn and Linear Regression Model, can we make accurate predictions about how the values will change over the years?
GitHub Repo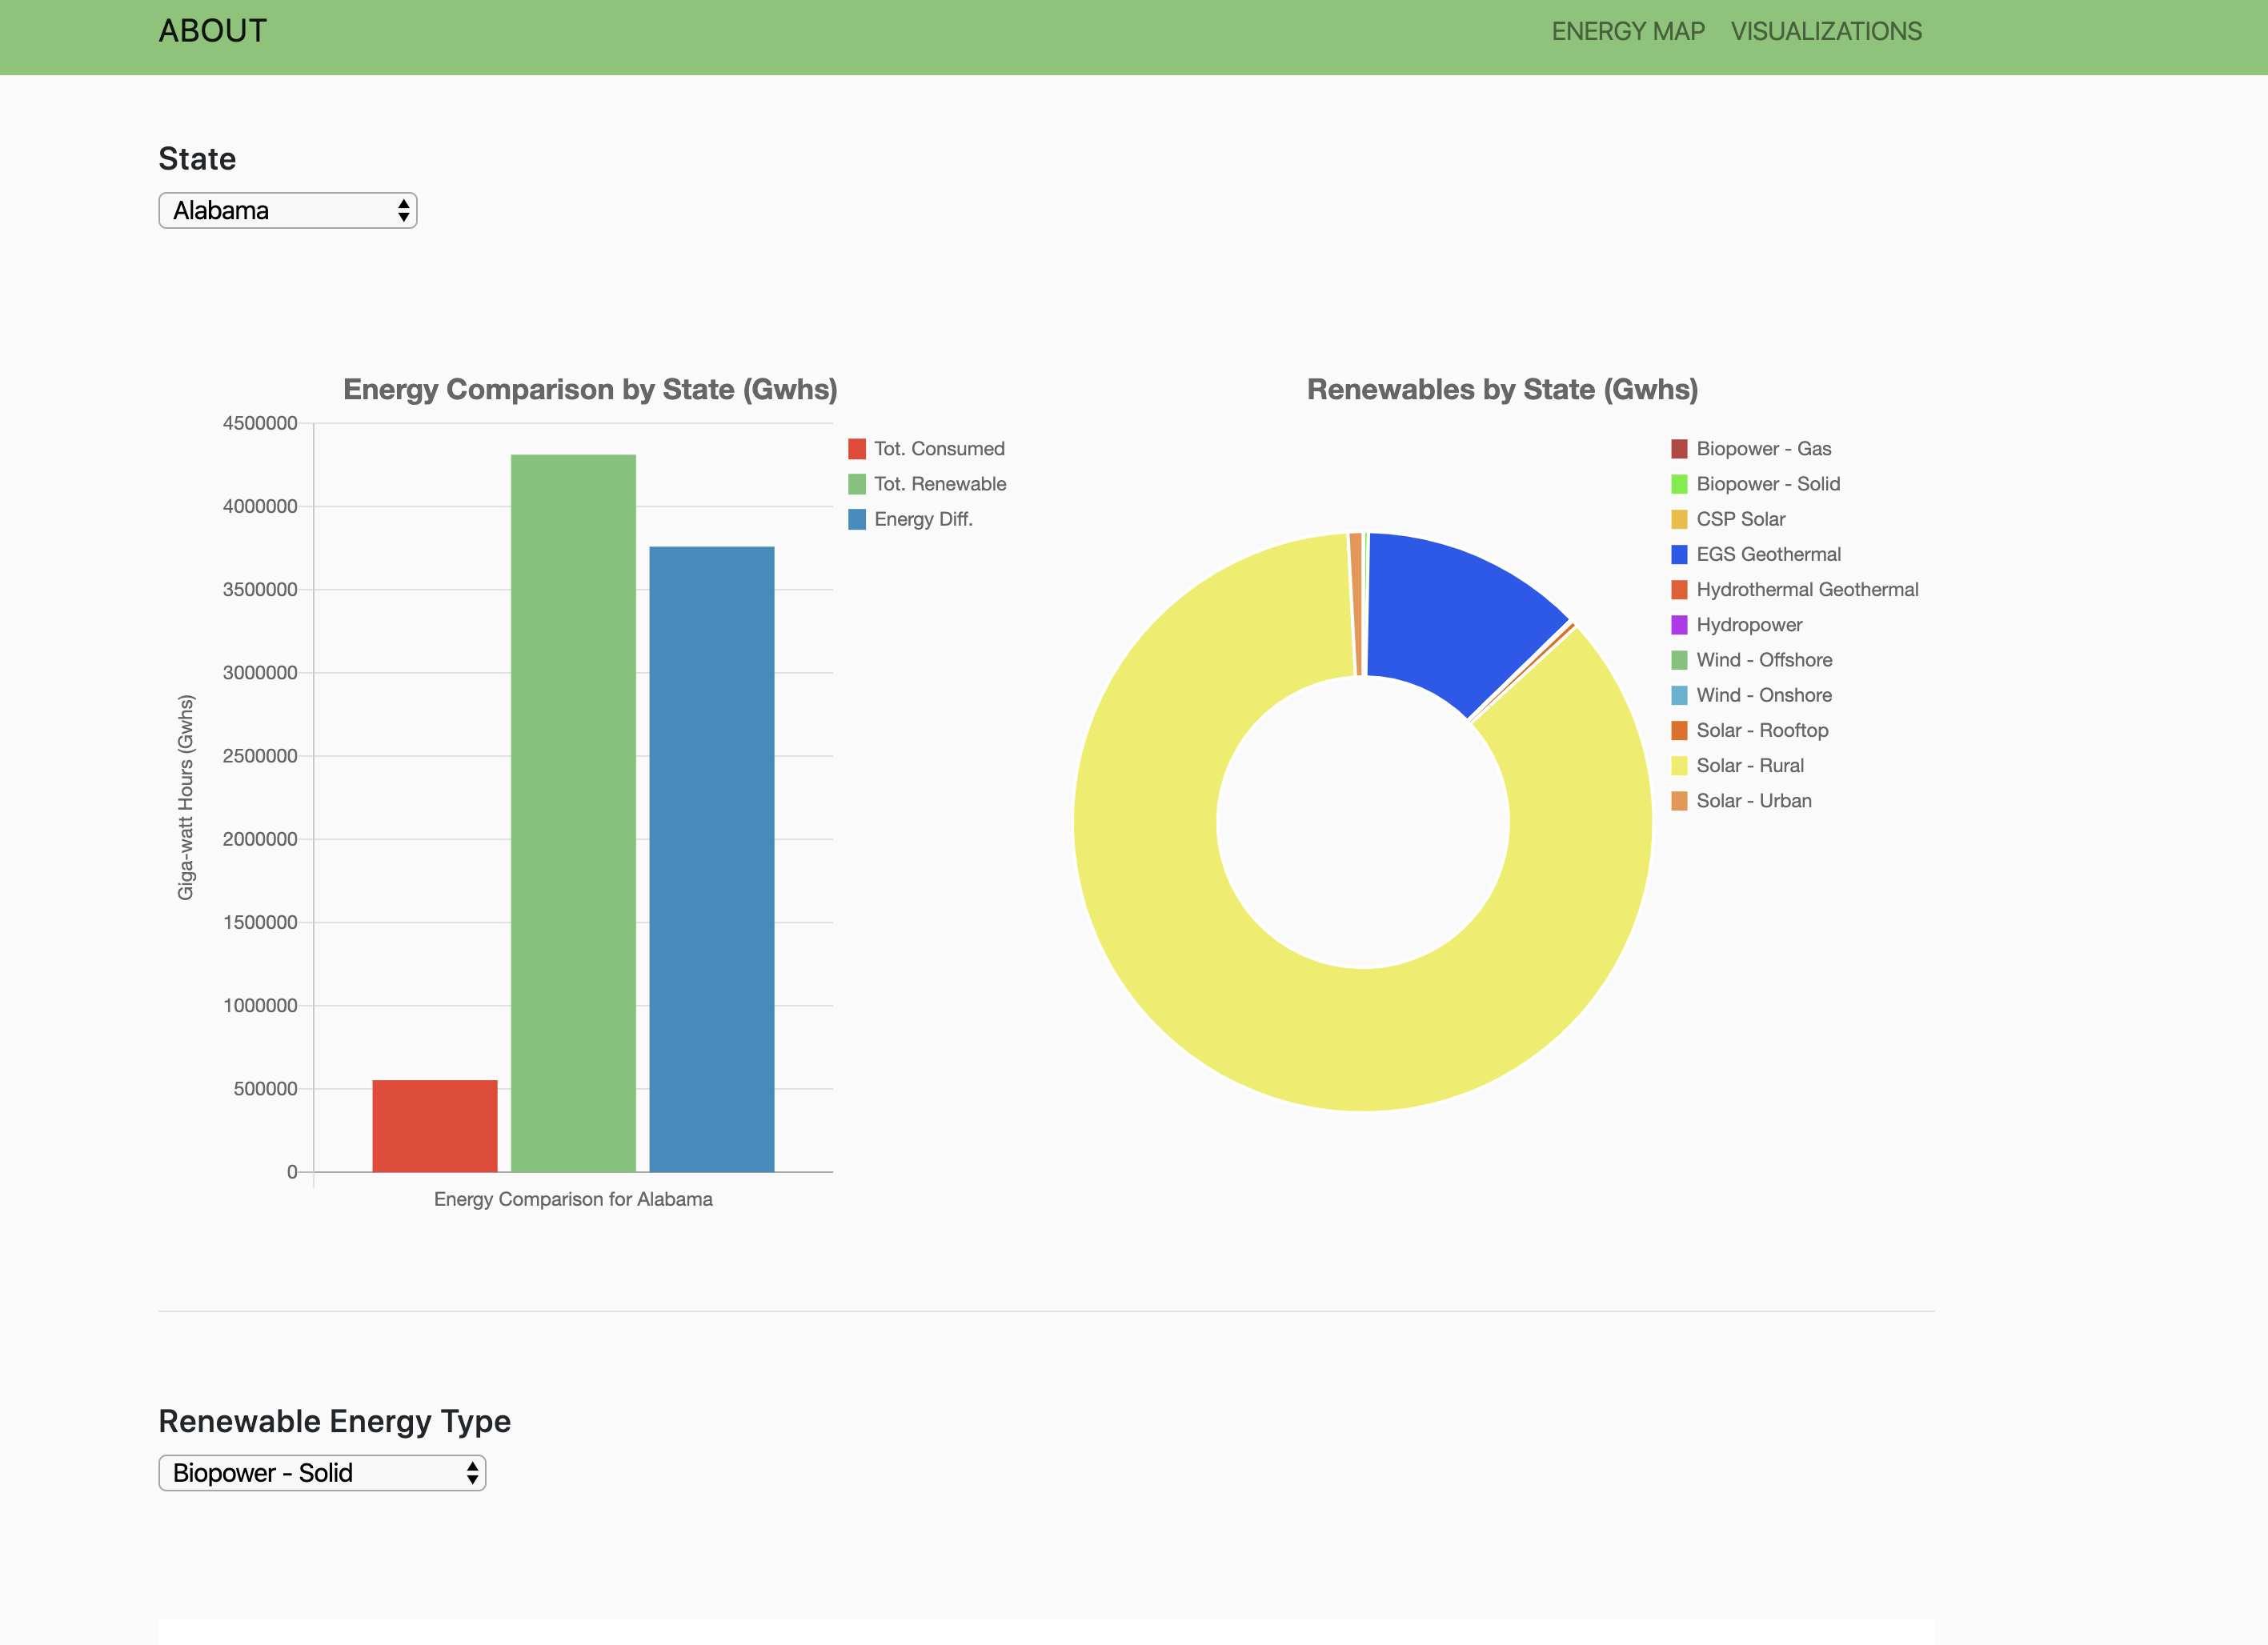
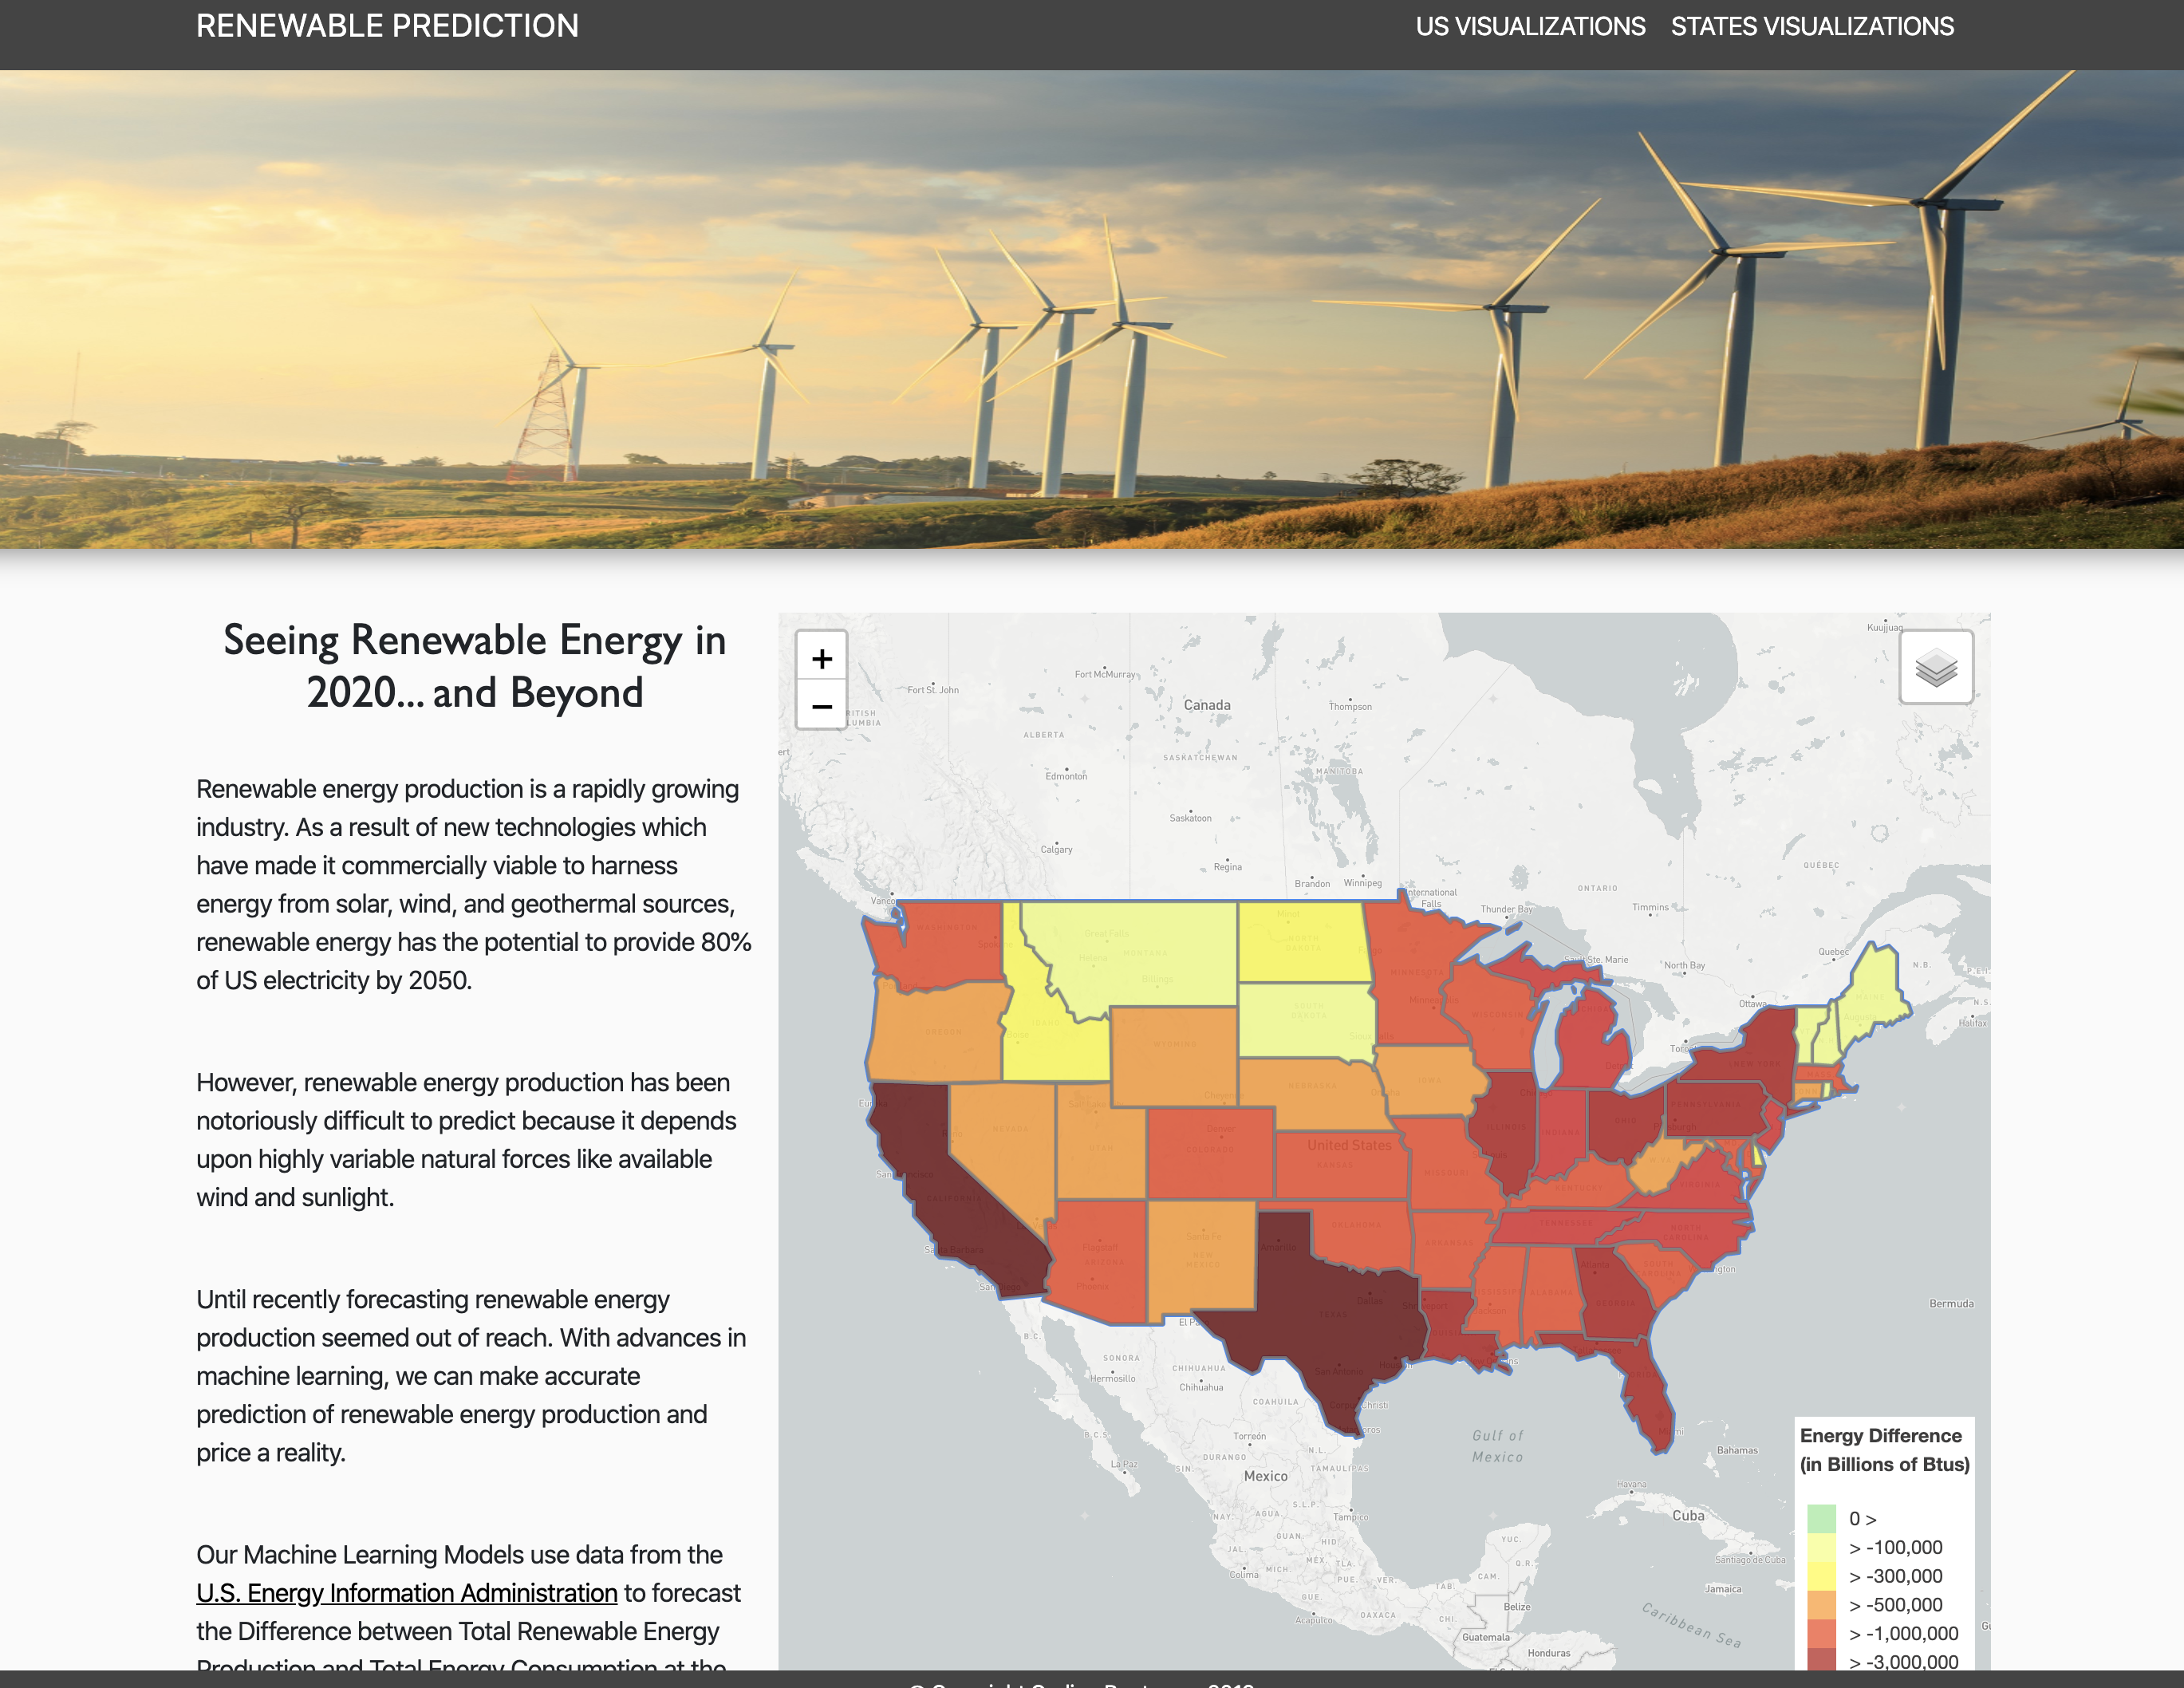
Green Energy Visualizations
Which states are using the most renewable energy? Total energy consumption vs. renewable energy potential by State: Can a State’s potential meet their consumption? Types of renewable energy by highest potential: Which types account for the most potential? Used Plotly, Chart.js and Leaflet for visualizations.
GitHub Repo
Air Quality
The Air Quality Index (AQI) is used for reporting daily air quality. It tells you how clean or polluted your air is. This project makes analysis for North Carolina and some other US cities. What are the main polutants? Is there any relationship between weather and air quality - such as high temperature and air pressure. The data is retrieved using the IQAir Visual API.
GitHub Repo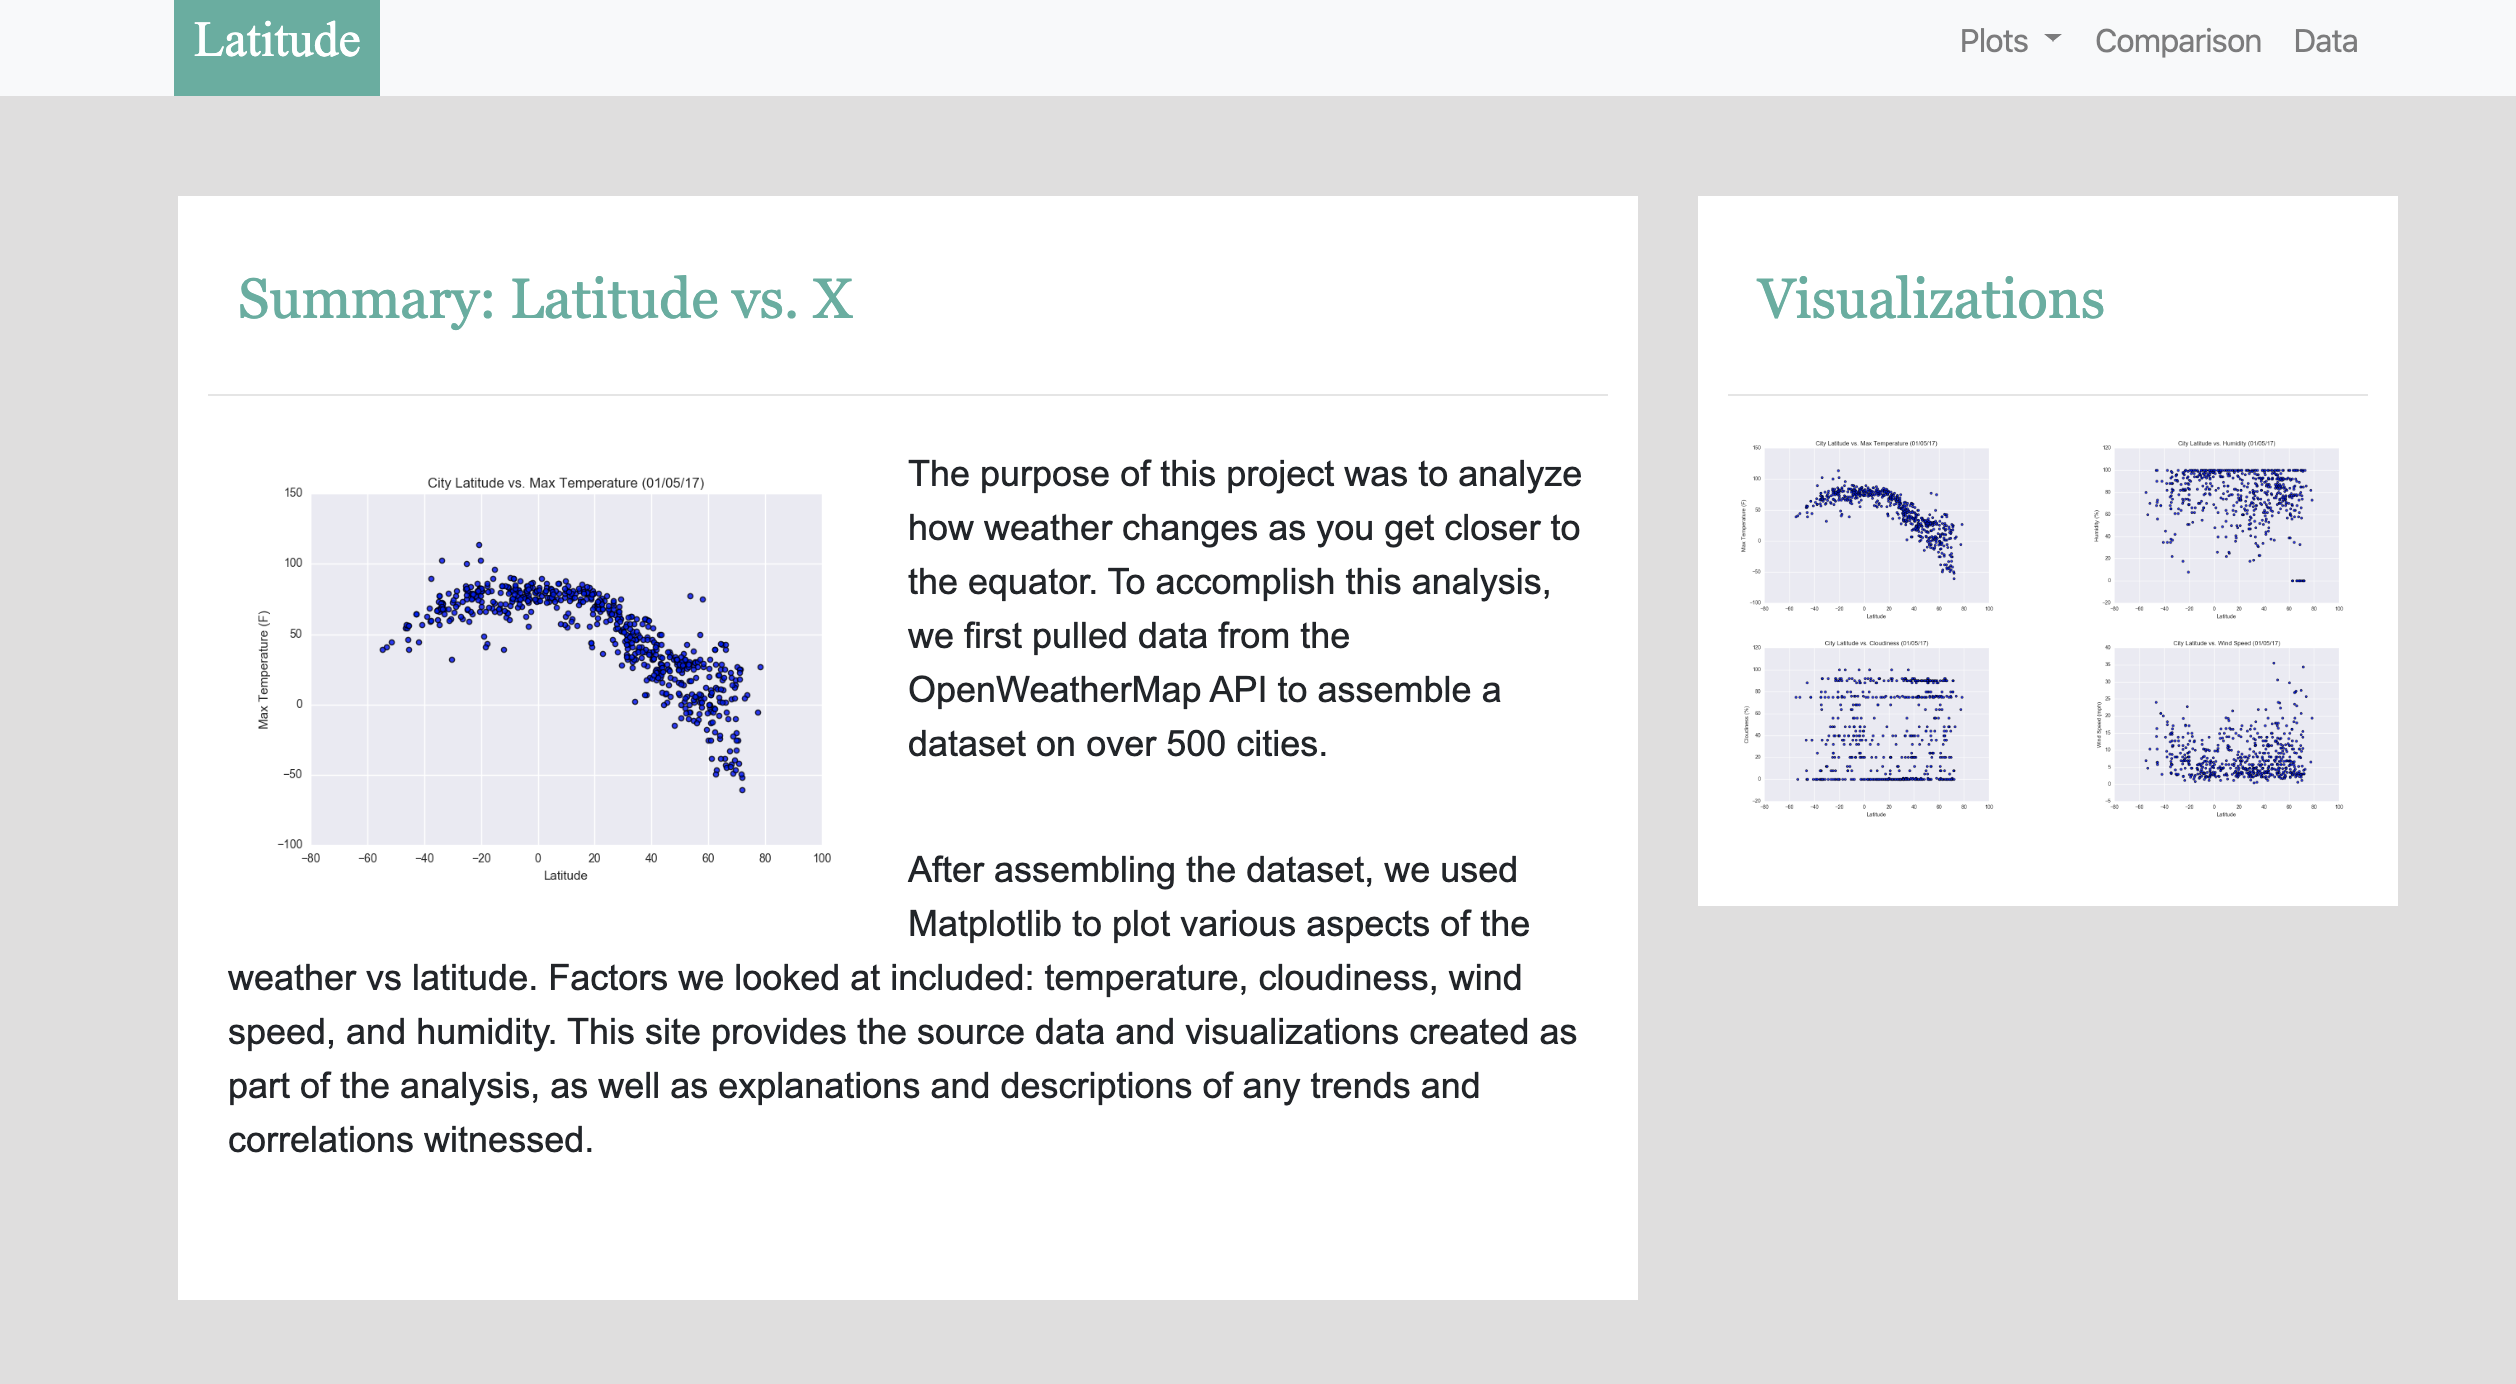
Weather Visualizations
The purpose of this project was to analyze how the weather changes as you get closer to the Equator. Get the data from the OpenWeatherMap API to assemble a dataset on over 500 cities. Use Python, public APIs, Pandas and Matplotlib to analyze and visualize the data.
GitHub Repo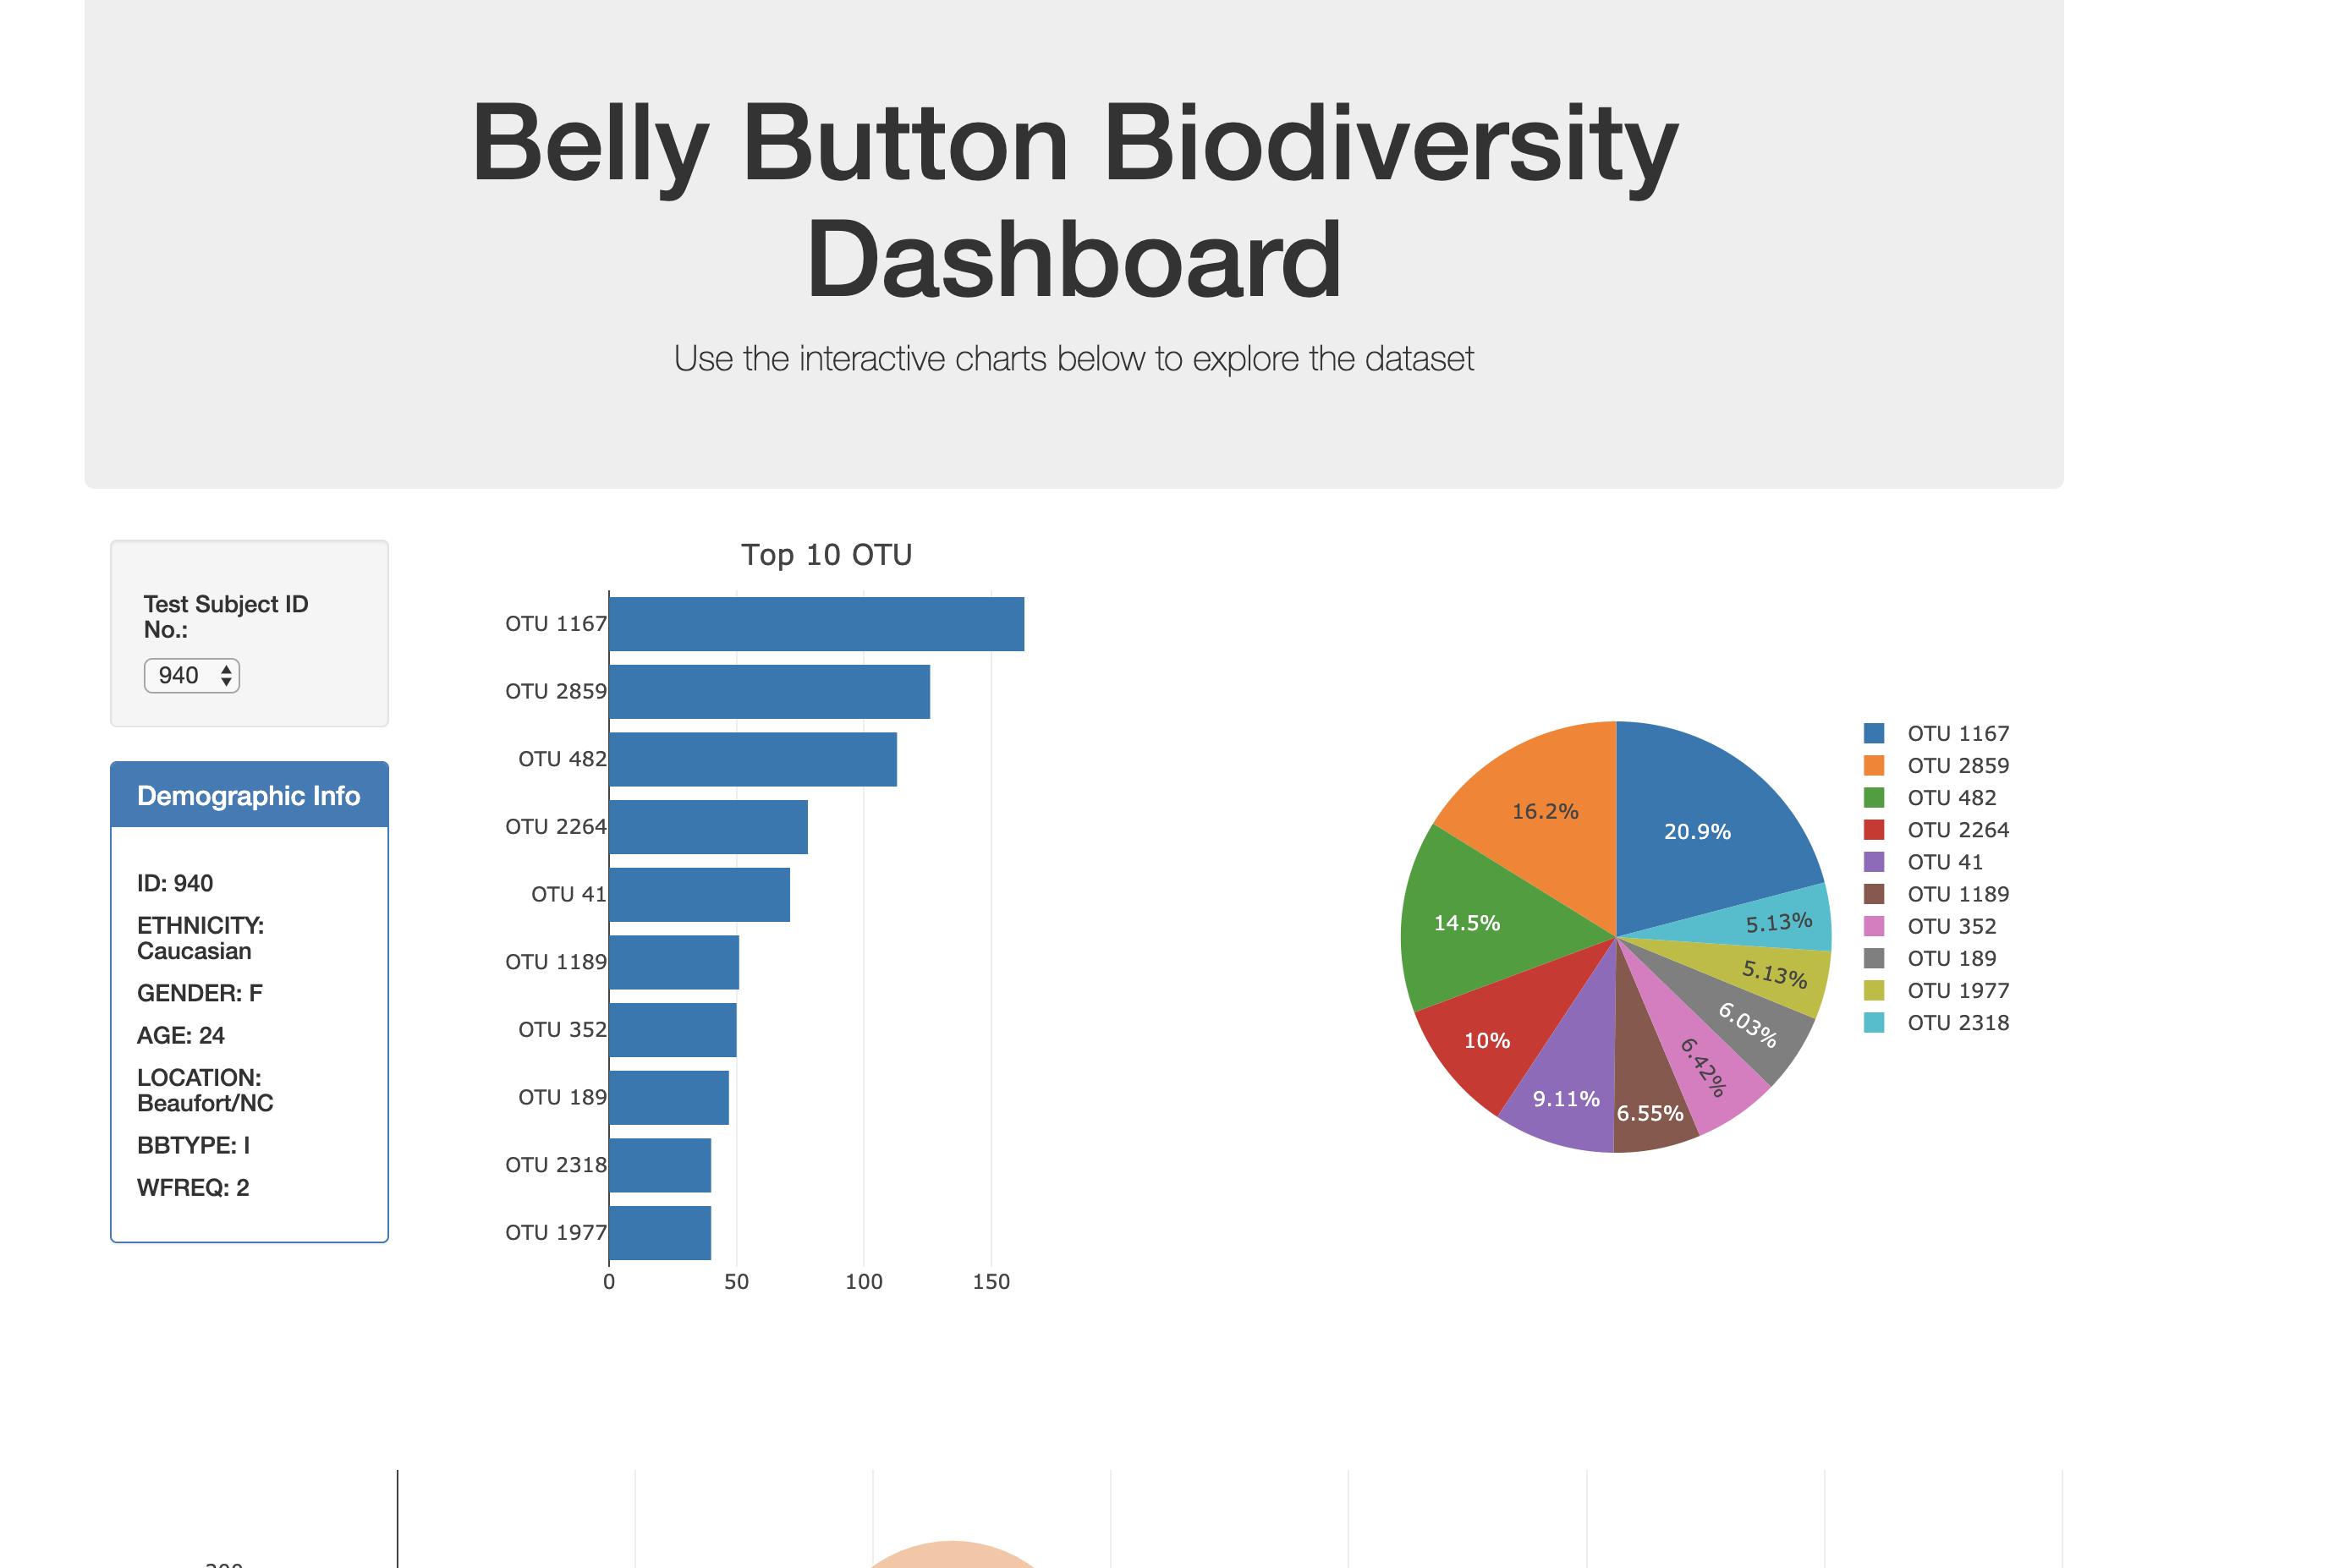
Biodiversity Dashboard
Using D3, Plotly and Javascript, built an interactive dashboard to explore the Belly Button Biodiversity dataset, which catalogs the microbes that colonize human navels.
GitHub Repo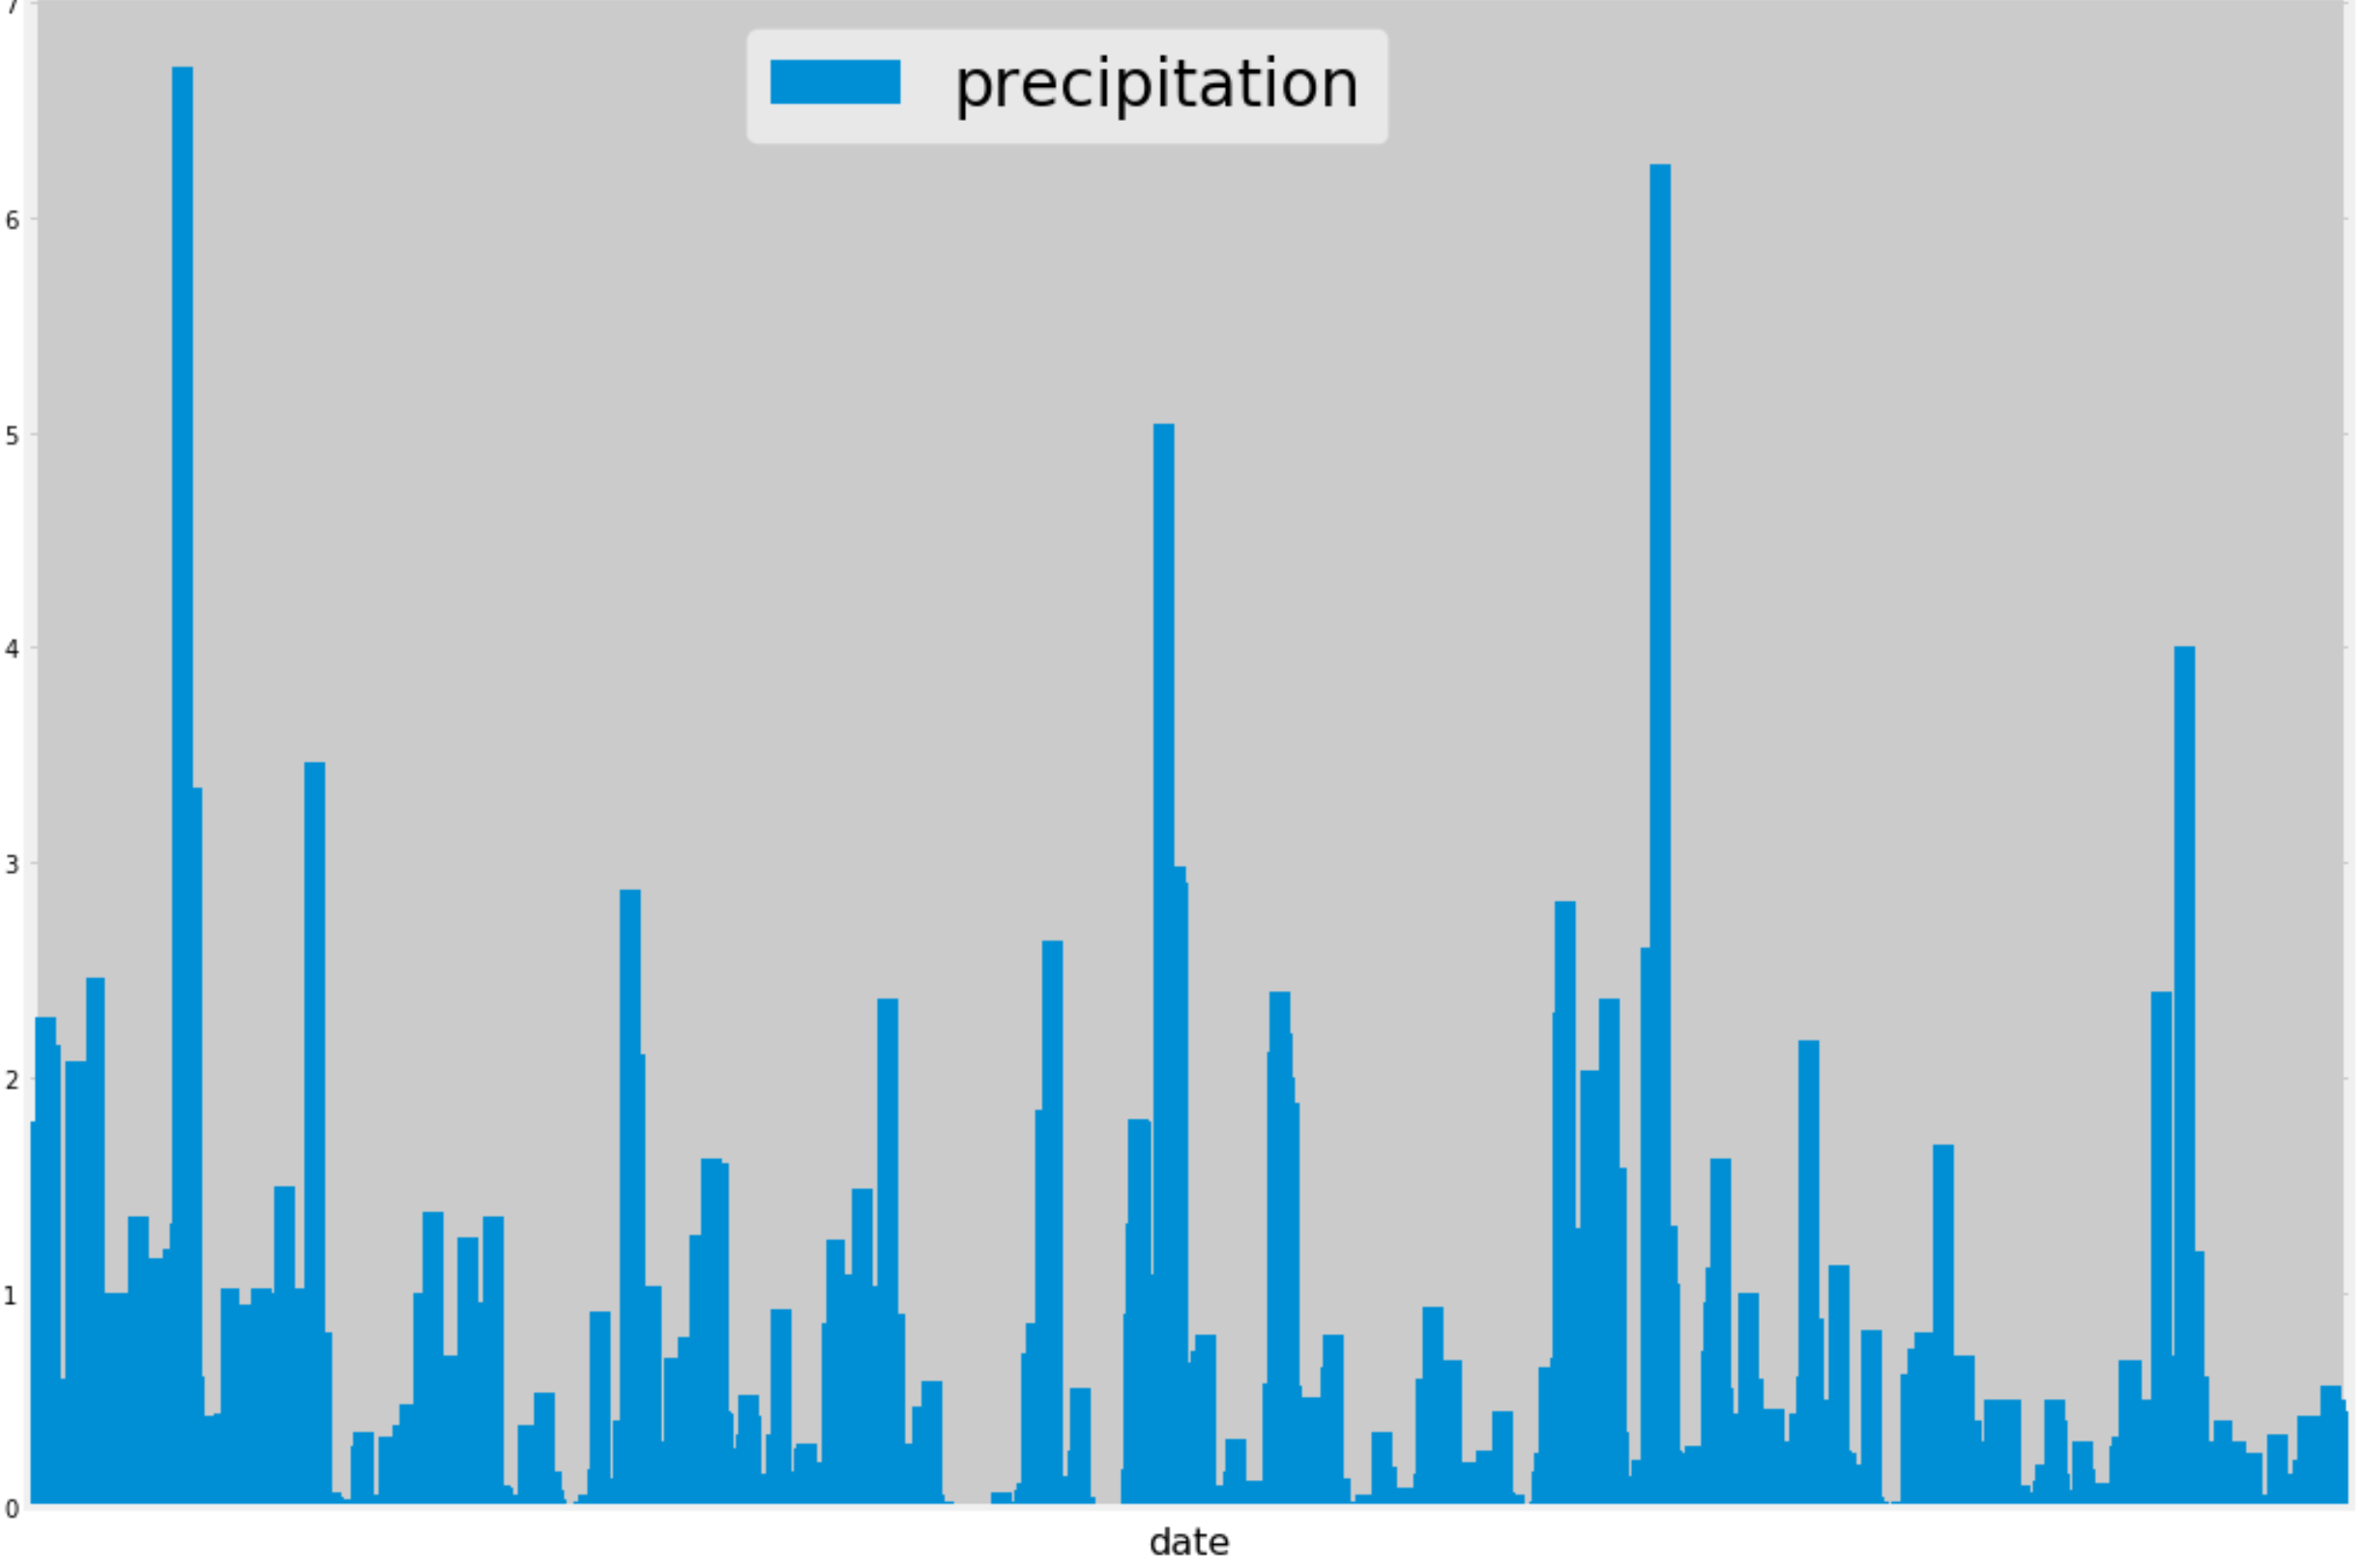
Climate Analysis
Used Python, SQLAlchemy, Pandas and Matplotlib to analyze climate and data exploration of a SQLite database. Designed an API with Python & Flask, based on the data queries that was developed.
GitHub Repo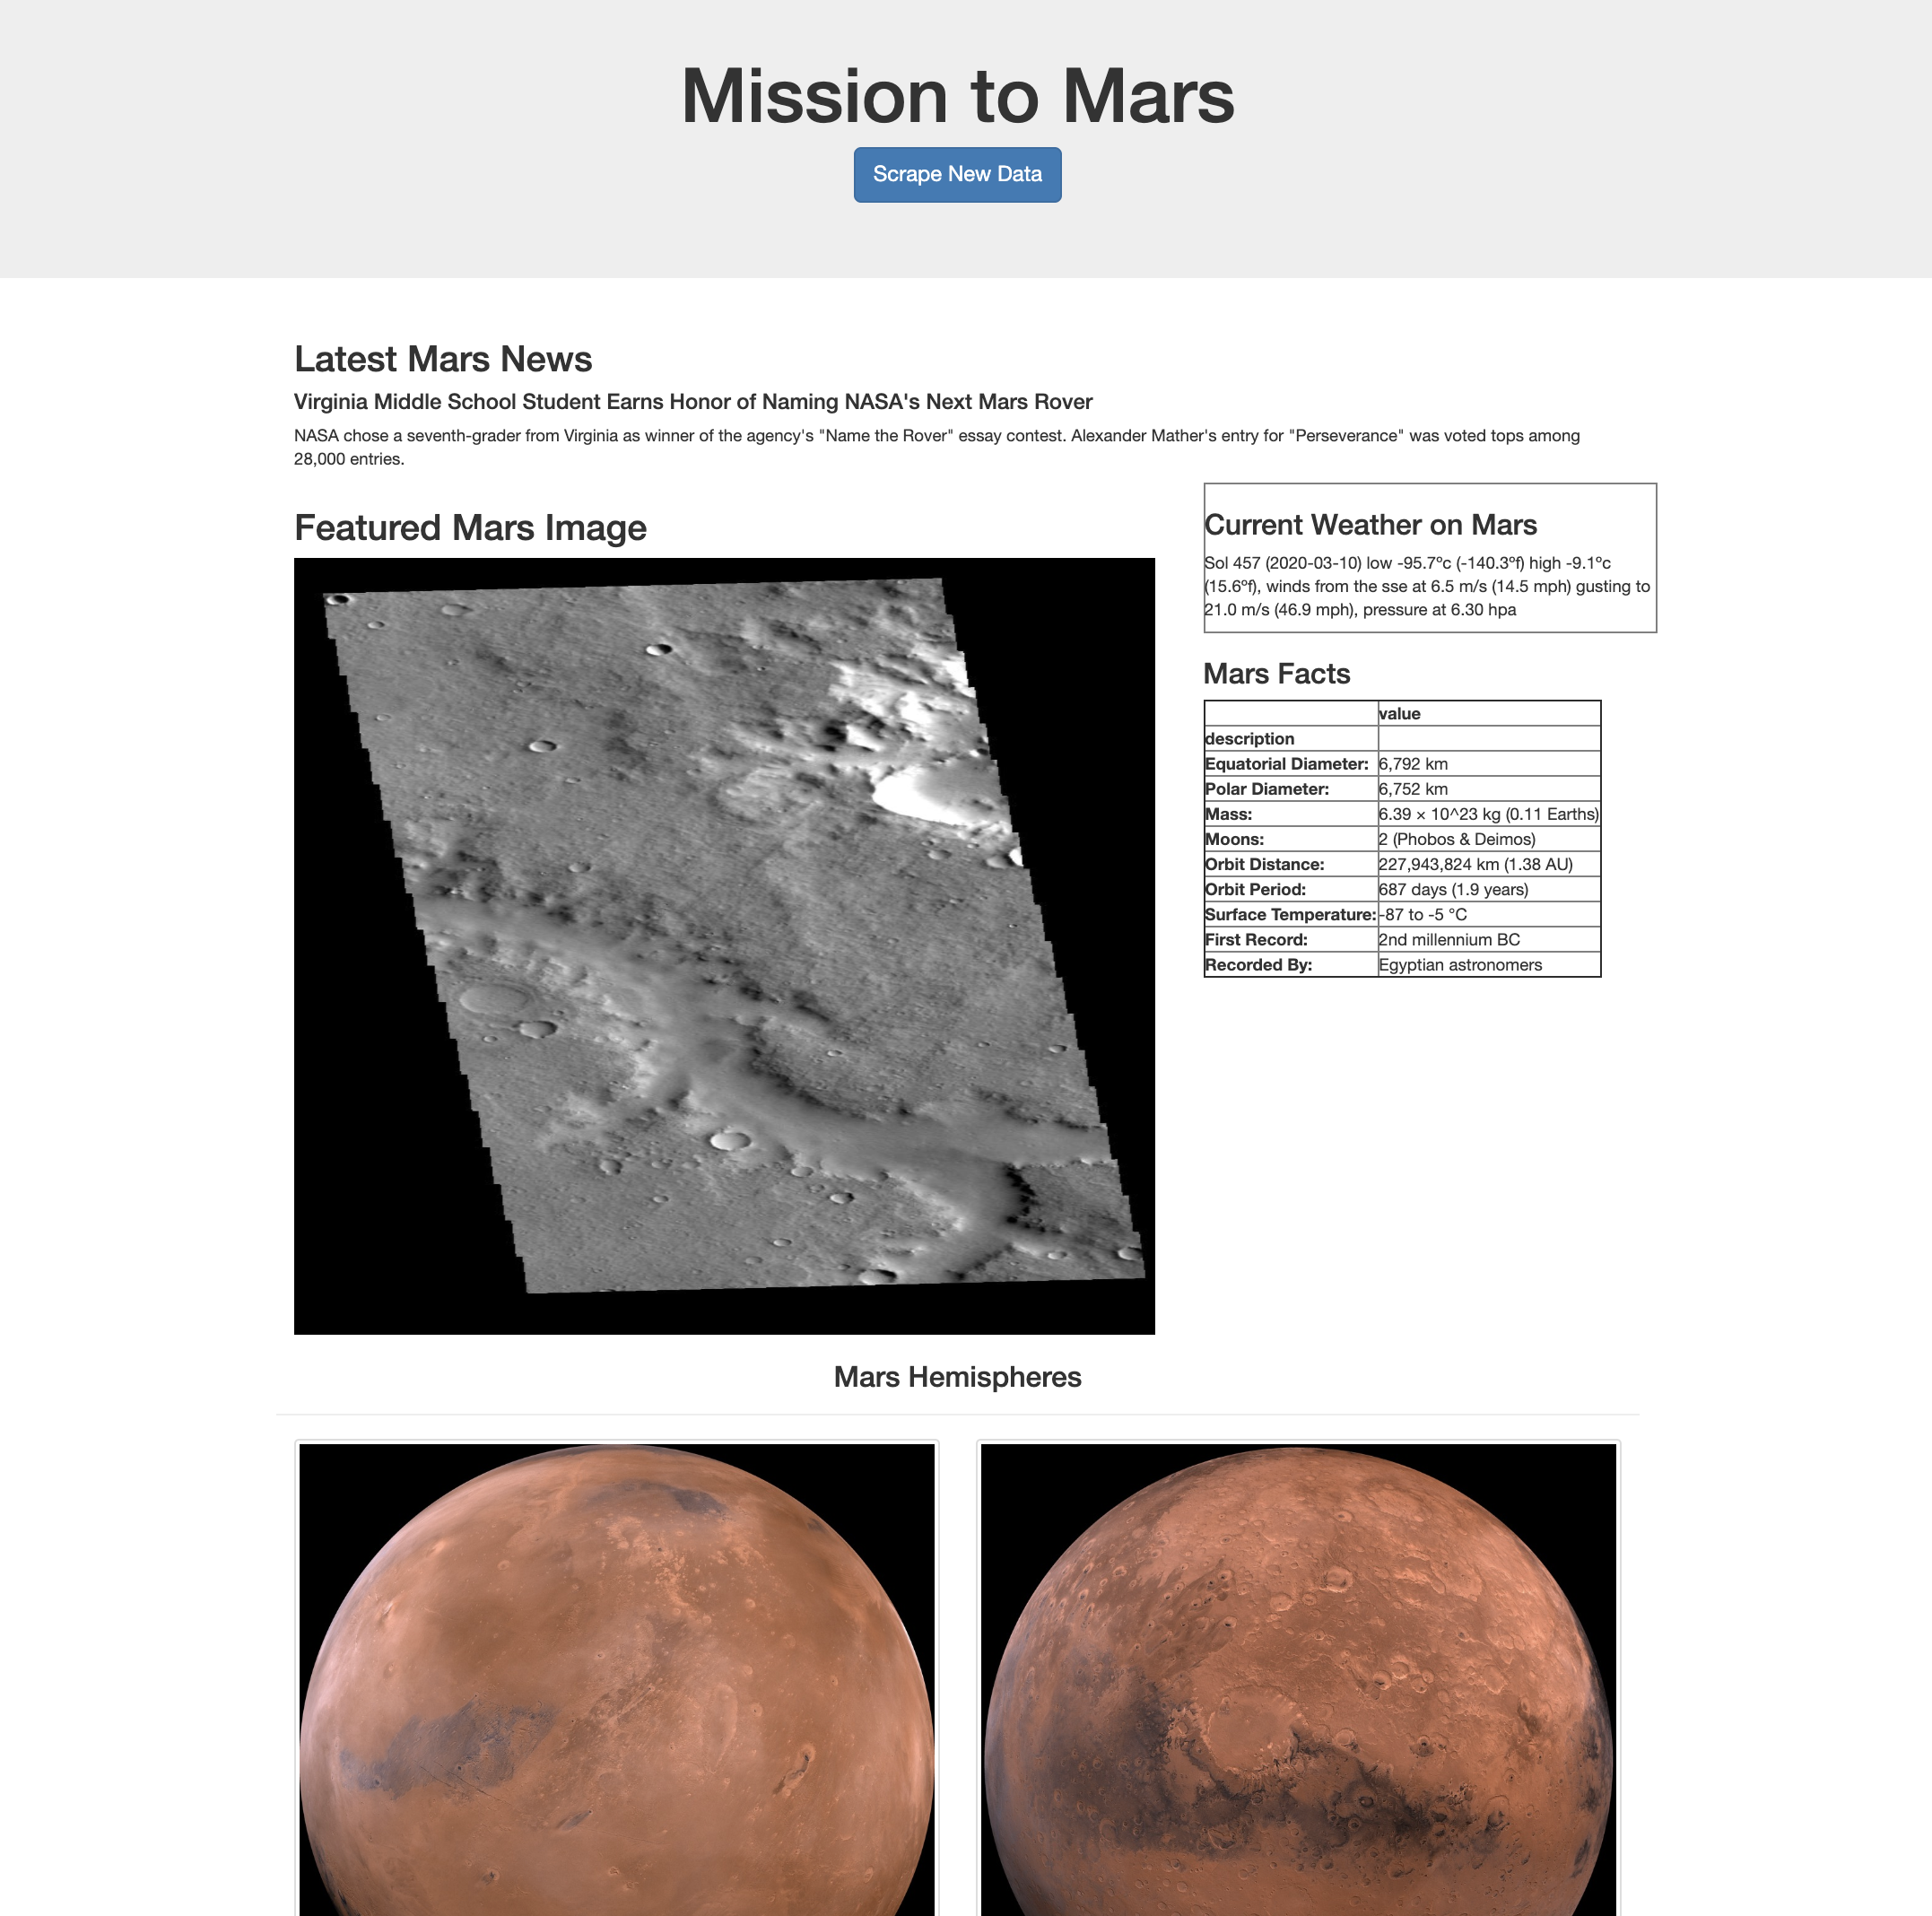
Mars Scraper
Used MongoDB with Flask to create a dashboard that displays the Mars information that was scraped from different web sites. Completed the scraping using Jupyter Notebook, BeautifulSoup, Pandas, and Requests/Splinter.
GitHub Repo
Earthquake Maps
Create a map that displays a legend, popups, and markers using Leaflet that plots the earthquakes from the data set based on their longitude and latitude. The data is from the USGS website which provides earthquake data in different formats. Added a heatmap and a cluster map to show different visualization options.
GitHub Repo